Hotel Booking Demand

Project Summary
This project is an analysis of 2 Hotels, named Resort Hotel and City Hotel, regarding their bookings and their guests to get some insights and understand about their business. The analysis starts with cleaning the data and then we do exploratory data analysis (EDA) to answer several business questions. For this project, the dataset was derived from Kaggle. The details of this projects are written below.
The tools:
- Python (Pandas, SQLite3) for cleaning and exploring data
- Python (Matplotlib, Seaborn) for visualization
The steps:
- I did the data cleaning from raw data using Python and make sure the data is feasible to be analyzed.
- Performed Exploratory Data Analysis (EDA) using SQL lite and for examining following research questions:
- How many bookings were canceled?
- Where are guests mostly coming from?
- What months are mostly busy?
- Which month have the highest number of cancelations?
- Bookings by market segment?
- How long do guests stay at the hotels?
- How much do guests pay a room per night?
- How does the price vary per night over the year?
- Created visualization using Matplotlib library and Seaborn.
Project Files
For more comprehensive analysis and visualization, please open this file:
- Jupiter Notebook - Analysis
- First, I replaced all null values and categorized them into '0' or 'Unknown'.
- Replaced 'Undefined' from meal column into 'SC', as they have the same meaning.
- Dropped some rows that have zero guest on adults column, including children and babies.
Data Cleaning
Data Analysis
1. How many bookings were canceled?
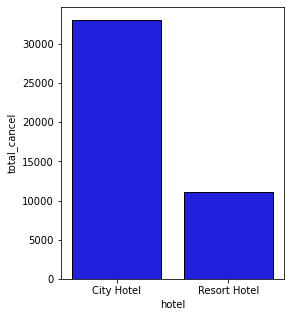
Interpretation: The number of booking cancellation at City Hotel was 33,079 cancellations, while Resort Hotel were 11,120 cancellations.
2. Where are guests mostly coming from?
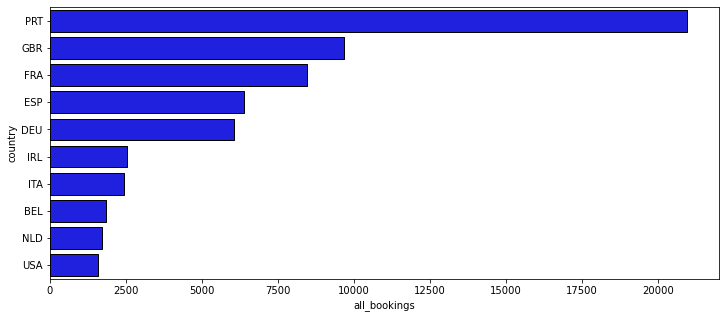
Interpretation: Mostly, hotel guests came from Portugal (20,977), United of Kingdom (9,668), and France (8,468)
3. What months are mostly busy?
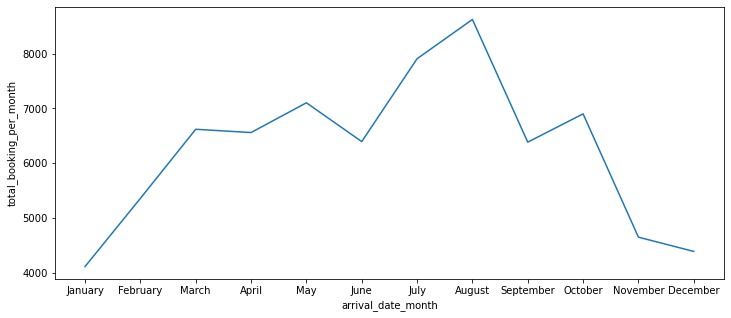
Interpretation: August (with 8,624 bookings) is the most busiest month during the year. Following by July (7,907) and May (7,103)
4. Which month have the highest number of cancellations?
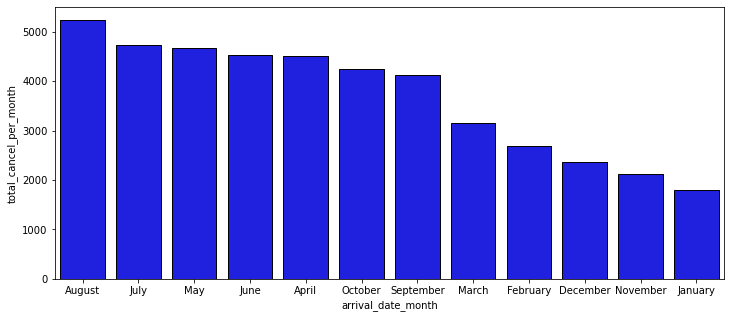
Interpretation: August has the highest number of cancellations.
5. Bookings by market segment?
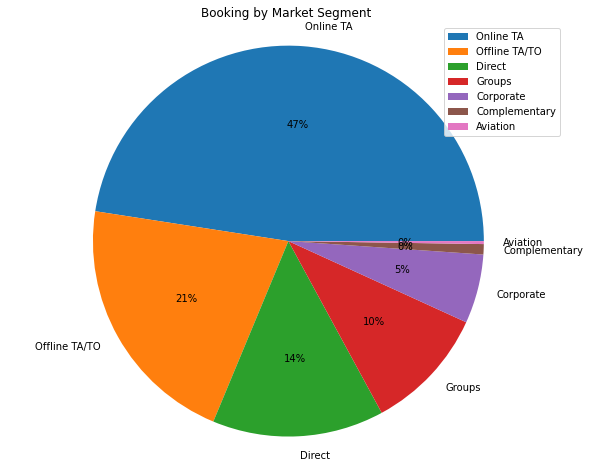
Interpretation: The bookings were mostly coming from Online Travel Agents (47%)
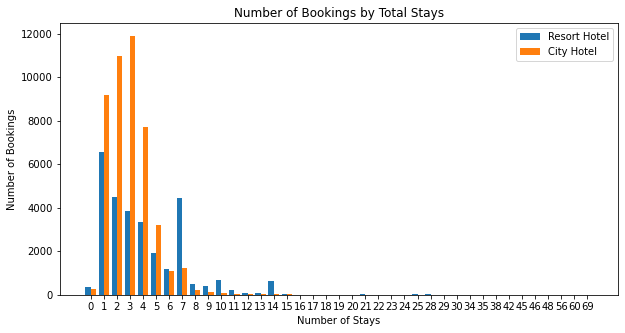
6. How long do guests stay at the hotels?